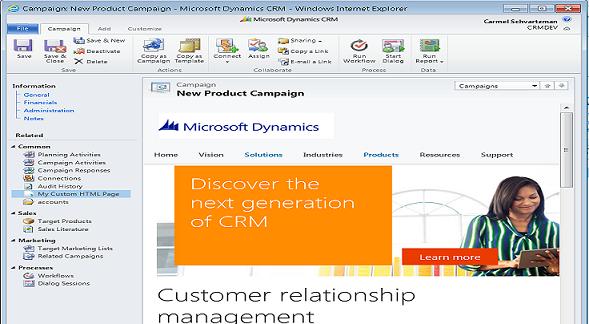
After you have coded you javascript files, you want to find them for debugging purposes. It could be a not easy task to find them between the hundreds of source files that Dynamics 365 will load to the browser:
How to find and debug your custom Javascript files in Dynamics CRM / 365
To debug quickly your javascript files, just follow this steps:1) Open the FORM of the Entity your are working on, and go to the Properties of the Form. Open the Web Resources and find the JAVASCRIPT LIBRARY that you want to debug. Double-click it to open the editor:
2) Once opened the Editor, type into your javascript file , the "debugger; " command:
3) Save it, save the Form, Publish it and open the Developer's Tools of the browser:
4) Then , just perform the Click or anything else that would trigger your javascript code: from here, you can add breakpoints to stop the script execution.
That's all...
In this article we've seen Step by step How to find and debug your custom Javascript files in Dynamics CRM / 365 in 5 minutes.
Enjoy Microsoft Dynamics 365 CRM!
In this article we've seen Step by step How to find and debug your custom Javascript files in Dynamics CRM / 365 in 5 minutes.
Enjoy Microsoft Dynamics 365 CRM!
by Carmel Schvartzman
כתב: כרמל שוורצמן


No comments:
Post a Comment